

TL;DR
- This blog is for engineering students, electronics freshers, and audio enthusiasts in India who want to understand what an audio spectrum analyzer is, how it works, and where it is actually used in real projects and careers.
- An audio spectrum analyzer takes a sound signal and breaks it into its individual frequency components, showing you what a waveform actually looks like on the inside.
- Most modern digital spectrum analyzers, from studio plugins to laboratory instruments, analyze a signal in the frequency domain using techniques such as FFT or digital filtering.
- Audio spectrum analysis can be implemented using FFT-based methods, filter-bank or octave-band methods, and other specialized architectures. In modern software, FFT is also commonly used to calculate octave-band information.
- Spectrum analysis is not just a music production tool. It shows up in GATE level signals and systems theory, telecom testing, EMC compliance, acoustics, and applications such as acoustics, telecom testing, EMC measurements, and audio equipment testing.
An audio spectrum analyzer is a device that will show you the frequencies of a sound signal and how much energy is present at each frequency over the audible spectrum of approximately 20 Hz to 20 kHz. Rather than displaying the signal as a waveform that changes over time, it reorganises the information to show which frequencies are present and their relative amplitude or energy. It is this simple, fundamental change of point of view from the time domain to the frequency domain – that makes the audio spectrum analyzer one of the most widely used diagnostic instruments in the field of audio, electronics and acoustics.
Sound, at its basic level, is not usually made up of just one frequency. A guitar note, a human voice, or even the hum produced by an electrical transformer can contain multiple frequency components. Engineers would be working in the dark without a way to separate and view those frequencies. In this blog, you will learn what an audio spectrum analyzer is, how it works step by step, the different types you may encounter, and why spectrum analysis is relevant to music production, engineering, and Signals and Systems concepts covered in GATE.
Also read
- Synchro Transmitter and Receiver: Working Principle and Applications
- Step Down Chopper vs Step Up Chopper: Key Differences Explained
- Step Down Chopper: Working Principle, Formula and Applications
What Is an Audio Spectrum Analyzer
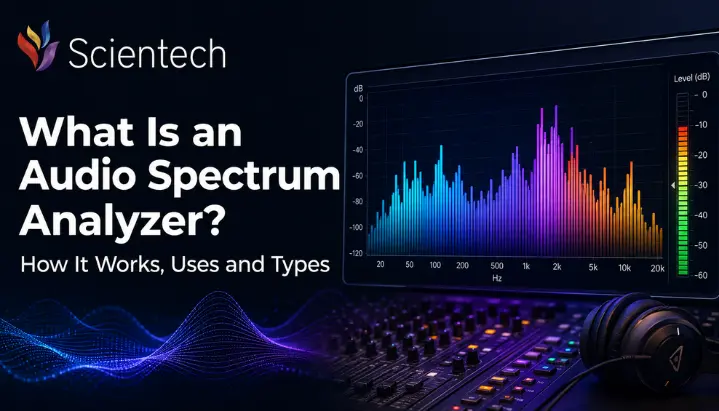
Imagine a radio equalizer with all of its vertical bars going up and down to music on an old stereo system. The bouncing display is an easy-to-use version of the audio spectrum analyzer. There are a variety of frequencies in each bar, and the bar’s height represents the strength of the frequencies at that moment.
An audio spectrum analyzer is an instrument or software to observe the amplitude of the sound signal as a function of frequency, and to display it as a graph on which the amplitude or level is plotted on the vertical axis and the frequency on the horizontal axis. Audio spectrum analyzers are generally designed to frequency range of human hearing from 20 Hz to 20 kHz, but sometimes extend beyond this range of frequencies in case of acoustics or industrial diagnostics.
A difference between a spectrum analyzer and a normal waveform display is the information it will provide you. Amplitude vs time is plotted in a waveform as you would see in Audacity or any other basic audio editor. It will inform you if a sound is becoming louder or quieter, but not what frequencies are responsible for the sound becoming louder or quieter. There is a spectrum analyzer which directly answers the second question. The same signal is being sent and the question is, what are the frequencies at this time and what is the amount of energy associated with each frequency.
How an Audio Spectrum Analyzer Works
A spectrum analyzer is an instrument that operates on a principle which can be easily explained by a simple analogy. If you were asked to give the names of all the fruits in a glass of a mixture, what would you say? Just drinking juice as such gives an overall idea, sweet, tangy, some mango taste. If you had a machine that would separate juice into the individual fruits (apple, mango, orange, pineapple), you could accurately measure the amount of each fruit in the juice. An audio spectrum analyzer is used to perform a similar operation as the above with sound. It analyses the combined signal and estimates how its energy or amplitude is distributed across different frequencies.
Converting from the Time Domain to the Frequency Domain
All sound signals are initially in the time domain. This simply means that amplitude is plotted as a function of time, as is done in a waveform display. What is actually a complex sound, such as a whole song or a human voice is a combination of many simple sine waves at various frequencies, all overlapping each other. The individual frequencies that make up a combined waveform are nearly impossible to tell simply by observing the combined waveforms.
This is where the frequency domain comes into play. In the frequency domain, a signal is described as the amplitude at each frequency, rather than the amplitude over time. The mathematical framework used for this is called Fourier analysis. Developed from the work of Jean-Baptiste Joseph Fourier, it allows signals to be represented in terms of their frequency components. Periodic signals can be represented using Fourier series, while the Fourier transform is used more generally for suitable non-periodic signals.
A particular kind of math known as Fast Fourier Transform (FFT) is applied in practical audio spectrum analyzers. FFT is an efficient algorithm for computing the Discrete Fourier Transform (DFT) of sampled digital data, which is what your computer, phone, or digital audio interface uses.
Basic Signal Chain
A typical audio spectrum analyzer processes a signal through following stages, whether it is a hardware instrument or a software plugin.
First, analyzer captures audio signal, either from a microphone, a line input, or a digital audio file. If the signal is analog, it passes through an analog to digital converter, or ADC, which samples continuous waveform at regular intervals and converts it into a series of digital numbers.
Second, the analyzer takes a small chunk of this digital signal, called a window or a frame, and applies a windowing function to it. This step exists because FFT math assumes the signal repeats infinitely, and abruptly cutting a signal into small chunks creates artificial edges that distort the result. A windowing function, such as a Hann or Hamming window, smooths out these edges before FFT is applied.
Third, the FFT algorithm processes that windowed chunk of data and outputs a set of frequency bins, each representing a narrow range of frequencies along with amplitude present in that range. A larger FFT size gives you finer frequency resolution but takes slightly longer to compute, while a smaller FFT size updates faster but with coarser resolution. This is a genuine trade off that every spectrum analyzer has to balance.
Finally, analyzer takes this frequency data and renders it on screen, usually as a graph or a set of moving bars, refreshing many times per second to give you a real time view of sound’s frequency content as it changes.
A Simple Worked Example
Suppose you record a single musical note played on a tuning fork at 440 Hz, standard pitch for note A. If you fed this signal into a spectrum analyzer, you would see a single sharp spike at 440 Hz mark on frequency axis, with very little energy anywhere else. This is because a tuning fork produces a nearly pure sine wave at one frequency.
Now compare that to a note played on a violin at the same pitch, 440 Hz. On a spectrum analyzer, you would not see just one spike. You would see a strong spike at 440 Hz, called fundamental frequency, along with a series of smaller spikes at 880 Hz, 1320 Hz, 1760 Hz, and so on. These additional spikes are called harmonics, and they occur at whole number multiples of fundamental frequency. The relative strength of these harmonics is exactly what gives a violin its distinct tonal character compared to a tuning fork, a guitar, or a human voice singing the same note. This is a practical demonstration of why spectrum analysis matters. It reveals structure in a sound that your ear perceives as “tone” or “timbre” but cannot quantify on its own.
Types of Audio Spectrum Analyzers
Not all spectrum analyzers work the same way internally, and picking the right type matters depending on what you are trying to measure. Broadly, spectrum-analysis displays can be grouped by how they analyse and present frequency information, including FFT-based displays, octave or fractional-octave band analyzers, swept/filter-based systems, and spectrograms.
FFT-Based Spectrum Analyzers
FFT based analyzers, as described above, digitize incoming signals and run Fast Fourier Transform algorithm on it. Their main advantage is the ability to provide detailed frequency-domain information with adjustable frequency resolution. A well configured FFT analyzer can show you individual frequency bins just a few Hertz apart, which makes it excellent for pinpointing exact problem frequencies, such as a specific resonance, a hum at 50 Hz from Indian mains power, or a whistling feedback frequency in a live sound system.
FFT analyzers are standard choice in music production plugins like Voxengo Span, in DAWs like Ableton Live and Logic Pro, and in most browser based online audio spectrum analyzer tools, since they are computationally efficient and easy to implement in software.
Real Time Analyzers and Octave Band Analyzers
A real-time analyzer (RTA) commonly displays audio energy in octave or fractional-octave bands. Depending on the implementation, these bands may be produced using digital filters or derived from FFT data. An octave band doubles in frequency from its starting point, so a band centered at 1000 Hz covers roughly 707 Hz to 1414 Hz.
This banding approach is useful for acoustic measurements because octave and fractional-octave bands provide a standardized way to group frequencies and are commonly used in sound-level and room-acoustic measurements, and live sound reinforcement. Historically, RTAs were built using parallel analog bandpass filters, one filter per band, which is why they are sometimes called filter bank analyzers. Modern digital RTAs often calculate FFT data internally and then re-bin it into octave bands, blending both approaches.
Swept Tuned and RF Spectrum Analyzers
Swept-tuned spectrum analyzers are a traditional architecture most commonly associated with RF measurements rather than modern audio spectrum analysis. They sweep a tunable filter across a frequency range and measure amplitude at each point as sweep progresses. This method is less suited to rapidly changing audio signals because the analyzer sweeps through frequencies over time, so the measured spectrum can become difficult to interpret when the signal changes significantly during the sweep. However, RF spectrum analyzers built on this principle remain essential in telecommunications, Wi Fi diagnostics, and radar work, and it is useful for electronics students to recognize this older architecture, since it still appears in exam questions and lab instrumentation.
Spectrogram Displays
A spectrogram is technically not a separate analyzer type but a different way of visualizing the same FFT data. While a standard spectrum analyzer shows frequency versus amplitude at a single instant, a spectrogram adds a third dimension, time, typically shown as a scrolling image where horizontal axis is time, vertical axis is frequency, and color or brightness represents amplitude. Spectrograms are especially useful for studying how a sound evolves, such as watching the harmonic structure of a spoken word unfold or spotting a brief click or dropout in a recording.
| Analyzer Type | Best For | Frequency Resolution | Common Use Case |
|---|---|---|---|
| FFT based | Music mixing, mastering, pinpointing exact frequencies | High, adjustable via FFT size | DAW plugins, online audio spectrum analyzer tools |
| RTA / Octave band | Acoustics, live sound, noise measurement | Standardised octave/fractional-octave bands | Room EQ, sound level compliance, PA tuning |
| Swept tuned | Radio frequency and telecom testing | Depends on filter bandwidth | RF diagnostics, EMC compliance testing |
| Spectrogram | Visualizing frequency change over time | Same as underlying FFT | Speech analysis, forensic audio, bioacoustics |
Real Time Audio Spectrum Analyzer vs Offline Analysis
A common point of confusion for beginners is the difference between a real time audio spectrum analyzer and an offline or file based one. A real time spectrum analyzer processes live audio input, from a microphone or a line in signal, and updates its display continuously, often dozens of times per second. This is essential for tasks like live sound mixing, where an engineer needs instant feedback to catch feedback frequencies or tonal issues before they become audible problems.
Offline analysis, by contrast, works on a pre recorded audio file. analyzer can take its time, apply larger FFT windows for higher resolution, and often generates a full spectrogram of the entire file rather than just a snapshot. Some free browser-based audio spectrum analyzer tools offer both live microphone analysis and audio-file analysis, although their features and privacy models vary, letting you either monitor your microphone live or drag and drop a WAV or MP3 file for detailed inspection.
For students learning concepts, an online audio spectrum analyzer is often the easiest entry point, since no software installation is required and you can immediately see how different sounds, from a tuning fork to a recorded voice, look when converted to frequency domain.
Applications of Audio Spectrum Analyzers Beyond Music
Spectrum analyzers are often introduced through music production, but their real world use extends far beyond a recording studio, which is exactly why the concept is worth learning seriously as an engineering student rather than dismissing it as a music production gimmick.
In music production and mastering, spectrum analyzers help engineers spot problems like excessive low end buildup, harsh resonant frequencies, or an imbalanced mix, all of which are difficult to catch by ear alone, especially on speakers or headphones with limited bass response.
In acoustics and noise measurement, octave band spectrum analyzers are used to assess sound levels in workplaces, construction sites, and public spaces against regulatory noise limits. Noise measurements may use frequency-weighting curves such as A-weighting, which apply standardised adjustments to account for the frequency-dependent sensitivity of human hearing.
In telecommunications and wireless systems, RF spectrum analyzers, not audio spectrum analyzers, are used to identify interference, verify transmitter performance, and diagnose issues in Wi-Fi, cellular, radar, and other wireless systems.
In electronics manufacturing and quality testing, related forms of spectrum analysis are used to investigate switching noise, harmonic distortion, and electromagnetic emissions. These applications generally use electrical or RF measurement equipment rather than an audio spectrum analyzer. Audio spectrum analysis may still be used to evaluate harmonic distortion in audio output stages. EMC testing is a related but separate area that evaluates unwanted electromagnetic emissions and susceptibility to electromagnetic interference.
In speech and hearing research, spectrograms generated from spectrum analysis are used to study how vowels and consonants are formed, to develop hearing aids, and to build front end of voice recognition systems.
Audio Spectrum Analyzers in Indian Context
India’s audio and electronics industry has grown rapidly alongside expansion of OTT platforms, podcast production, gaming studios, and telecom infrastructure, all of which rely on some form of spectrum analysis in their workflow. Post-production studios working on films, regional cinema, and OTT content may use spectrum analyzer plugins during mixing and mastering as part of broader quality-control and audio-monitoring workflows.
On the hardware and telecom side, Telecom operators, network-equipment manufacturers, electronics companies and research organisations use RF spectrum analysers for network testing, interference troubleshooting and product compliance under Indian telecom regulations. Public sector units and defense research organizations, including DRDO laboratories working on communication and sonar systems, also use spectrum analysis as a core diagnostic tool.
For students, this means spectrum analysis is not an isolated topic confined to one industry. It bridges audio engineering, telecommunications, electronics manufacturing, and even government research roles, which makes it a genuinely useful concept to understand early in an engineering education rather than something to learn only if you specifically pursue music production.
GATE and Exam Relevance
For students preparing for GATE Electronics and Communication Engineering, Fourier-series and Fourier-transform concepts are directly relevant to Signals and Systems. Frequency-domain concepts are also relevant to GATE Electrical Engineering, although the exact coverage depends on the paper and syllabus. Frequency-domain concepts are also relevant to GATE Electrical Engineering, although the exact syllabus coverage differs. Related areas include Fourier series, Fourier transforms, and discrete-time frequency-domain analysis. The exact topics should be checked against the current official GATE syllabus, Fourier transforms and related discrete-time frequency-domain analysis. The exact topics should be checked against the current official GATE syllabus. These concepts provide an important mathematical foundation for many digital spectrum analyzers, particularly FFT-based analyzers.
Understanding how a spectrum analyzer works in practice, rather than just memorizing Fourier transform formula, gives students a genuine intuitive edge on GATE questions involving frequency response, windowing functions, and time domain versus frequency domain representations. Related signal-processing and instrumentation concepts may also appear in technical recruitment exams such as SSC JE and RRB JE, depending on the exam and syllabus
Beyond GATE, students pursuing electronics instrumentation, communication systems, or embedded audio projects will encounter spectrum analysis directly in coursework involving digital signal processors, or DSPs, and in lab experiments that require plotting a signal’s frequency response using tools like MATLAB, Python’s SciPy library, or dedicated lab instruments.
Career and Salary Insights
Understanding spectrum analysis opens doors across several career paths in India, each with a different salary trajectory depending on specialization and experience level.
Sound and audio engineering remains the most direct career path, covering roles in music production, film post production, live sound, and broadcast. According to industry salary data, Entry-level sound-engineering salaries in India vary considerably by city, employer, role and experience, so salary ranges should be treated as indicative rather than fixed, with mid-career professionals earning higher depending on their specialization and client base. Specialised roles such as game audio design and OTT post-production may offer higher earning potential depending on experience, portfolio, employer and project type, with experienced professionals potentially earning significantly more than entry-level roles, depending on specialization, experience, employer, portfolio, and project work, particularly when working on Bollywood, regional cinema, or major streaming platform originals.
Freelance audio engineering has also become a viable path for Indian professionals, with platforms connecting freelance mixing engineers to international clients at competitive per project rates, often supplementing or exceeding typical studio salaries.
Beyond audio specific roles, underlying skill of signal and spectrum analysis is valuable in broader electronics and telecom careers, including RF test engineering, EMC compliance testing, and embedded systems roles at telecom companies and electronics manufacturers, where familiarity with frequency domain analysis is often listed as a desirable or required skill in job postings.
Certifications from Avid, Dolby, or Apple in audio specific tools, alongside a solid grounding in underlying signal processing theory covered in electronics engineering coursework, tend to make candidates significantly more competitive for both audio production roles and broader electronics testing positions.
Conclusion
An audio spectrum analyzer takes something you can only hear and turns it into something you can see and measure, breaking a sound down into its individual frequency components using Fourier transform. Whether you are working with a browser based online audio spectrum analyzer to check a mix, an octave band RTA to measure room acoustics, or an RF spectrum analyzer to test a telecom link, the underlying goal is the same: understand how signal energy is distributed across frequency. Digital FFT analyzers do this through frequency-domain computation, while other analyzers may use filter banks or different measurement architectures.
For engineering students, the value of this topic goes well beyond music production. It connects directly to GATE level signals and systems theory, shows up in telecom and EMC testing, and opens career paths ranging from film sound design to RF test engineering, all built on the same core skill of frequency domain analysis. The best way to build real intuition here is hands-on practice, so open a free online audio spectrum analyzer, feed it a few different sounds, a tuning fork, a song, your own voice, and watch how the frequency picture changes each time.
FAQs
An audio spectrum analyzer is used to visualize and measure the frequency content of sound. It helps identify which frequencies are present and how strong they are, making it useful for music production, acoustics, noise analysis, and audio equipment testing.
A waveform display shows amplitude changing over time, known as time domain. A spectrum analyzer shows amplitude at each frequency, known as frequency domain. Both represent the same underlying signal, just organized differently.
Yes, several free online audio spectrum analyzer tools let you analyze live microphone input or uploaded audio files directly in a browser, with no software installation required. These are ideal for students learning concepts for the first time.
An FFT based spectrum analyzer shows individual, narrow frequency bins and offers high precision, making it ideal for pinpointing exact problem frequencies. A real time analyzer, or RTA, groups frequencies into standardised octave or fractional-octave bands commonly used for acoustic measurements and live sound, making it standard choice in acoustics and live sound work.
Yes. Spectrum analysis is closely connected to Fourier-transform and frequency-domain concepts that are relevant to GATE preparation, particularly in Signals and Systems and related signal-processing topics. Check the current official syllabus for the exact coverage in your paper. Understanding how a real spectrum analyzer works can strengthen conceptual clarity for exam questions on frequency domain analysis.
No. A free online audio spectrum analyzer, or a free plugin like Voxengo Span, is enough to start learning fundamentals. Professional hardware analyzers are only necessary for specialized industrial, telecom, or compliance testing work.